Carbon Impact Report 2023: Our third year of being carbon-negative


Dive into our Carbon Impact Report, exploring our carbon metrics for 2023 and goals for the future.
In this report
- Headline stats
- Team emissions
- Platform operation emissions
- Managed charging savings
- Goals and achievements
- Summary
In our Carbon Impact Report for 2022, our analysis revealed an encouraging trend: ev.energy emerged as carbon-negative for a second year.
In essence, the carbon savings stemming from developing and scaling our EV Virtual Power Plant (VPP) exceeded the carbon footprint generated by our team and platform operations.
Since that milestone, our commitment to facilitating the transition to electric vehicles has remained steadfast. We've witnessed substantial growth in our user base, doubled the size of our team, and welcomed new partners on the journey with us.
Now, let's delve into ev.energy's carbon impact for the year 2023. Here's what our latest findings reveal.
ev.energy continues to be carbon-negative
We saved 387 tonnes of carbon in 2023 by delivering greener, cheaper, and simpler charging, our analysis shows.
By managing the charging of vehicles connected to our platform, we contributed an estimated carbon saving of 664 tonnes.
This substantial figure outweighed the estimated 277 tonnes of carbon emissions attributed to our team and platform operations, resulting in a net saving estimated at 263 tonnes for the year.
Team carbon: 242 tonnes

While our team size has doubled again in the past 12 months, our team's carbon footprint has not. We calculated a 43% increase in team emissions vs 2022. We continue to work fully remotely without an office or the need to commute. The primary cause for this reduction in team emissions per employee was reduced company travel, saving 0.95 tonnes of emissions per person.
Method
All of our employees were invited to calculate and submit their emissions associated with working for ev.energy - including sustenance, travel, and accommodation - through a guided carbon calculator.
The main difference between our calculations this year compared to 2022’s report is that we factored in the embedded carbon emissions from our work laptops and established a more accurate process for capturing our in-person Team Week emissions.
We then included a proportion of our employees' home emissions so we could account for heating, lighting, and powering their workstations.
To help us break this down for our employees in the US and the UK, we used benchmark data from the Homeworking Emissions Whitepaper 2020 produced by EcoAct, a leading international consultancy helping businesses to reduce their carbon impact.
To work out the energy consumption (kWh) we used the following calculations.

To establish what this equated to in kg/CO2 we needed to multiply this by average emissions factors in the UK and the US.

Results
- Employee travel and secondary emissions - 202 tonnes
- Office and heating emissions - 40 tonnes
- Total employee carbon emissions - 242 tonnes
Platform carbon: 35 tonnes

As a software company, we use few physical materials and rarely require products to be shipped across the globe. Nearly every tool we use to deliver our products and services is cloud-based, which helps to limit emissions.
Method
We use Amazon Web Services (AWS) to host our platform, as do nearly all platform service companies we work with.
First, we worked out the carbon impact of ev.energy’s AWS usage. Then we calculated the CO2 emissions per British pound.
This allowed us to assess the impact of all the cloud platforms we use for building and maintaining our products and services as well as running marketing, support, and business operations.
A couple of important factors to consider here have contributed to reducing our carbon emissions per pound spent:
- AWS is continuously improving the efficiency of its server instances meaning that we’re able to get the same amount of computing power or data storage while emitting much less carbon.
- AWS’s carbon reporting tool states that we have had net zero emissions for 2023. This is because the average grid emissions in Ireland, where our servers are based, have decreased as the availability of renewables on the grid has increased. Learn more on the Amazon sustainability website.
- There will still be some real-time marginal carbon emissions associated with running the cloud software. AWS uses a system of purchasing carbon credits to offset any carbon emissions meaning they can claim carbon neutrality.
- This claim of carbon neutrality does not include the lifecycle emissions of the servers, disposal of old servers, or the carbon cost of building the facility, so we have included these lifecycle emissions in our calculations.
Results
Our platform costs doubled last year, however, our platform emissions only increased by 30%, representing our increased efficiency.
Here is our platform's carbon emissions over the last 3 years:
- 2021 - 11 metric tons of CO2e
- 2022 - 25 metric tons of CO2e
- 2023 - 35 metric tons of CO2e
Managed charging carbon: 664 tonnes saved

At the heart of our operations lies our managed charging technology. This innovative solution enables us to charge electric vehicles globally using the cleanest energy sources, simultaneously offering financial benefits to drivers and grid operators. The exciting news is that as our company expands, so does the reach of our positive impact.
Method
Determining our impact was straightforward; it's a routine practice we engage in daily for our expanding user base of over 150,000.
To gauge carbon savings, we conducted a comparison between the CO2e that would have been produced during a charging session if the vehicle had been charged immediately upon being plugged in—what we refer to as the "counterfactual."
Next, we contrasted this with the CO2e emissions associated with the "actual" charging session, wherein we optimize for the most economical and environmentally friendly energy periods available.
Finally, we calculated the disparity in CO2e emissions between these two scenarios, providing us with our total savings.
Several key factors have significantly bolstered our carbon savings trajectory:
- The exponential growth of our user base directly correlates with the level of carbon savings we achieve. This explains the year-over-year increase in our carbon savings.
- We’ve enhanced the accuracy and broadened coverage of our carbon feeds across the US. These improvements have enabled us to accurately quantify savings in areas where we previously lacked data.
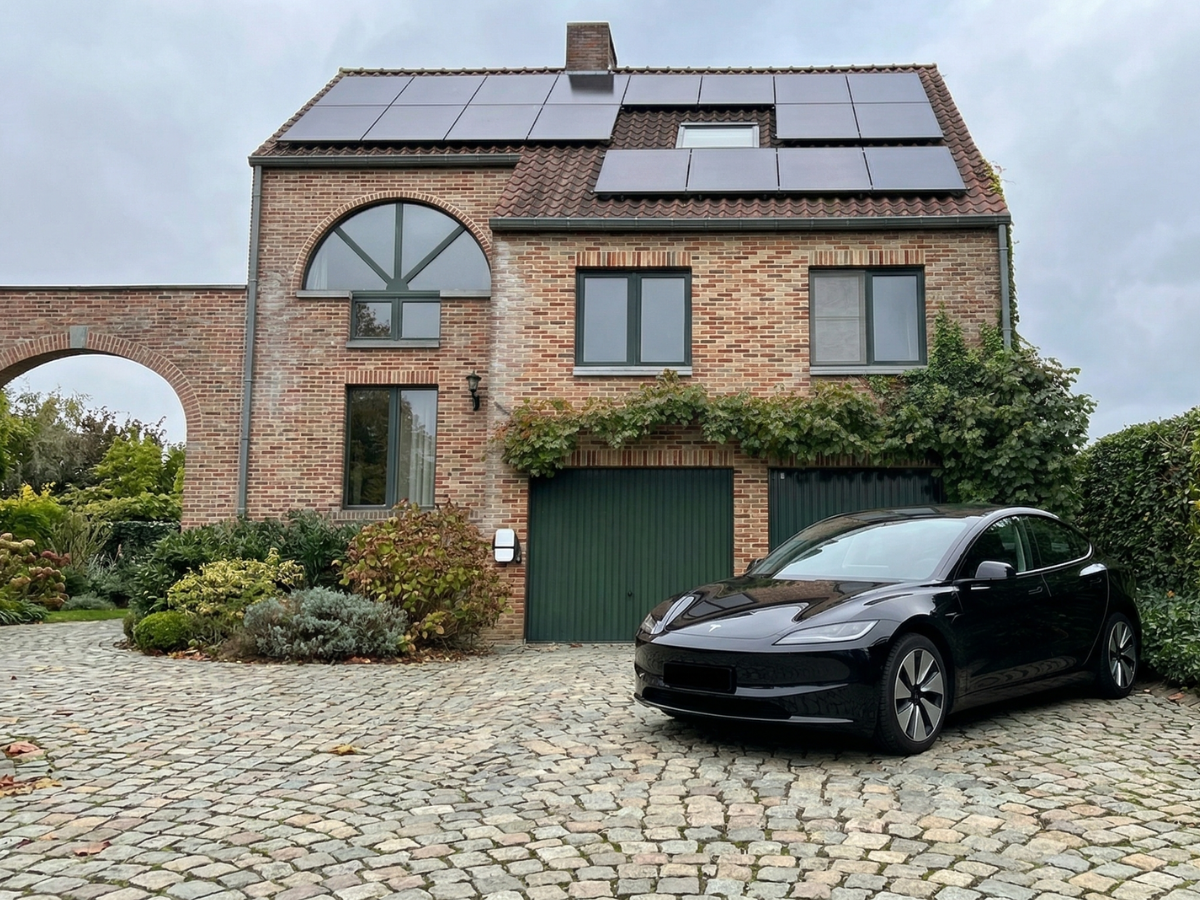
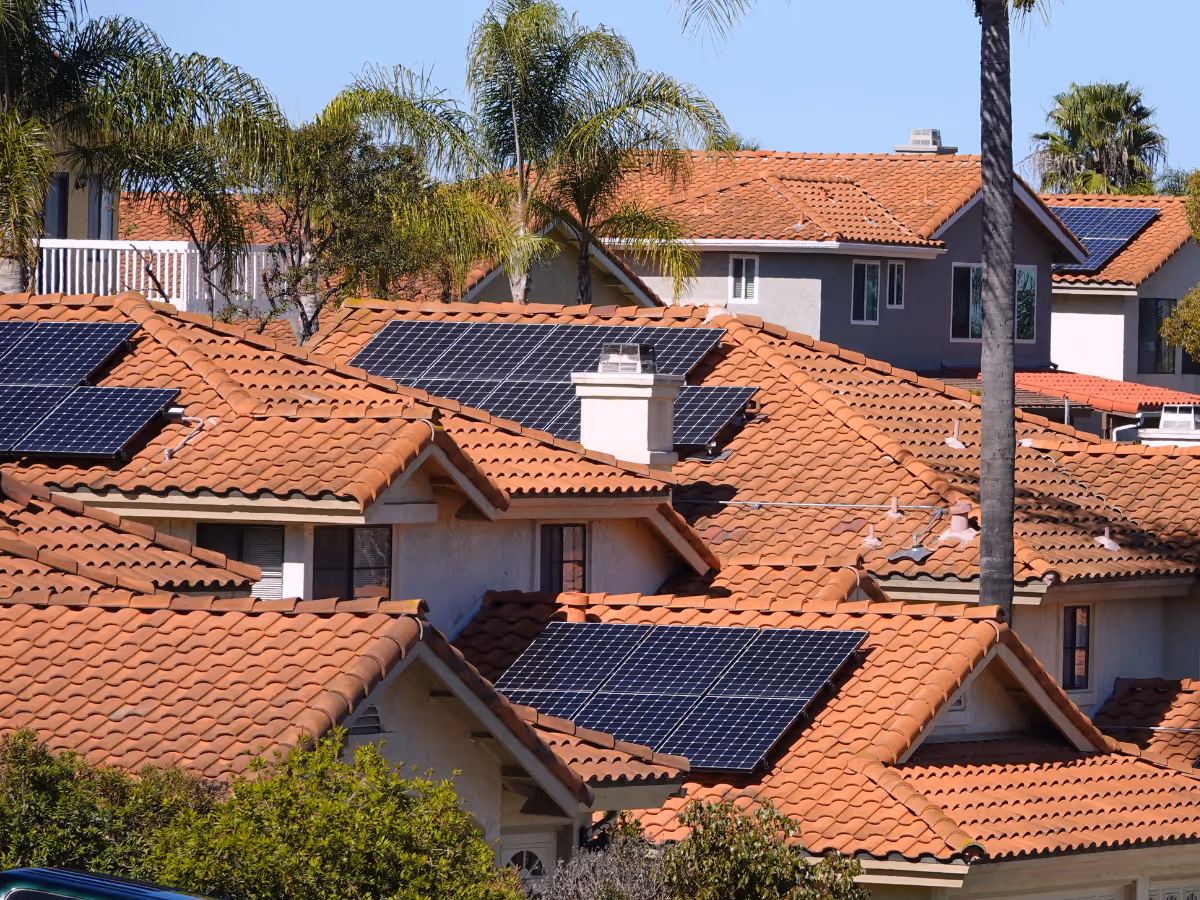
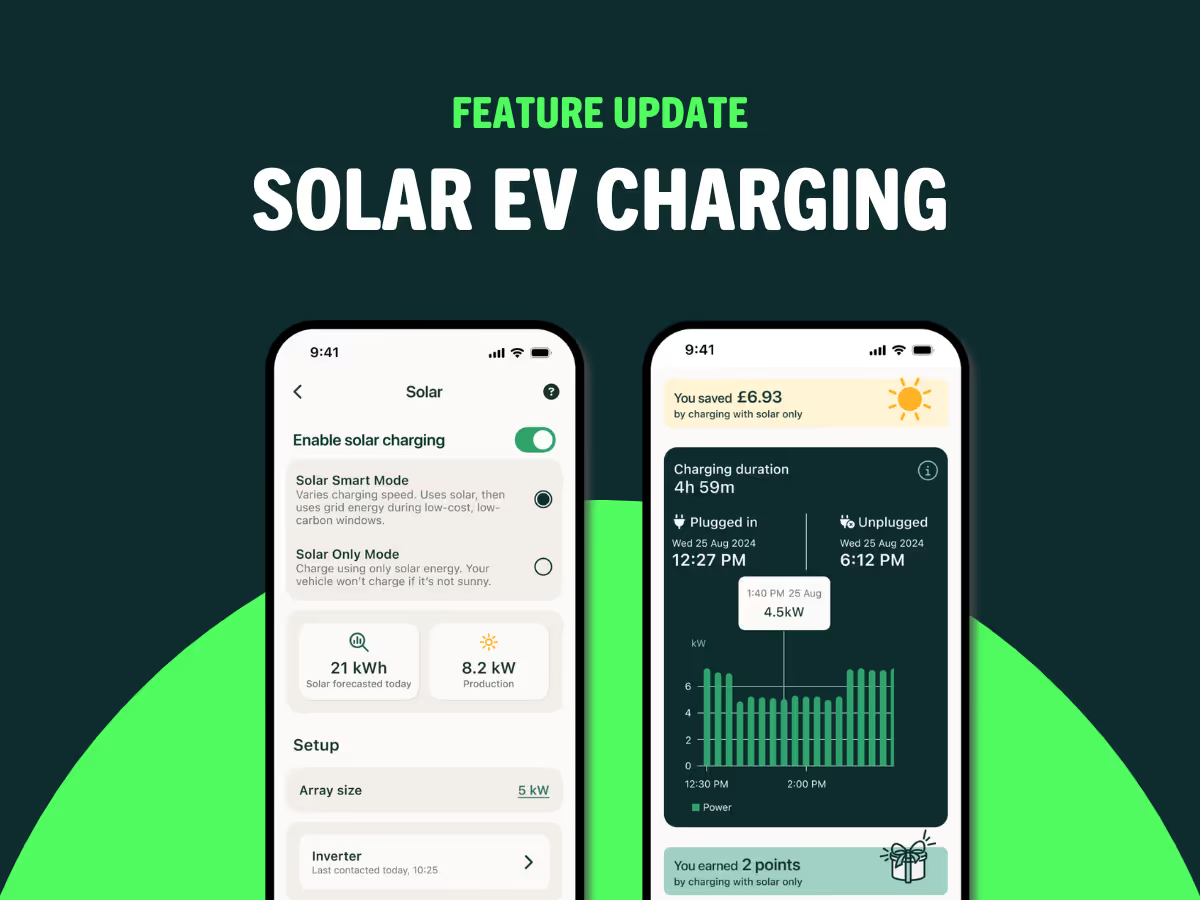
- In 2023, approximately 1,800 MWh of energy was supplied to electric vehicles on our platform through our Solar Charging feature. By matching EV charging with home solar production periods, we were able to increase our carbon savings even further.
- This year we’ve included drivers enrolled in passive managed EV charging programs with our utility partners. While we do not actively manage their charging they are still incentivized through ev.energy’s products and services to charge during the greenest periods. These passive charging programs accounted for 150 tonnes of our total savings.
Results
The savings generated by our managed charging technology have doubled, surging from 260 tonnes in 2022 to 664 tonnes in 2023. That includes ~30 tonnes of Solar Charging savings.
Our goals

In alignment with the United Nations' Sustainable Development Goals (SDGs), ev.energy has set forth a robust framework of aspirations to drive meaningful change and contribute to a sustainable future.

SDG 7.2: Increasing renewable energy integration
Indicator: Renewable energy’s share in the total final energy consumption
Our commitment to this target revolves around aligning the maximum percentage of EV charging to periods of high renewable energy production. By automatically scheduling charging sessions during optimal times on the grid, we aim to enhance the share of renewable energy in the global energy mix. We continue to focus on incentivizing drivers to plug in during periods of abundant renewable energy availability, thereby bolstering the overall global consumption of renewable energy.
SDG 9.4: Sustainable infrastructure and technology
Indicator: CO2 emission per unit of value added
Our objective is to drive EV adoption worldwide, thereby upgrading infrastructure and industries to embrace sustainable practices. We strive to increase our driver base by a significant percentage, amplifying the carbon emission reductions achieved through the transition from internal combustion engine (ICE) vehicles to EVs. By promoting clean and environmentally sound technologies, we aim to reduce CO2 emissions per unit of value-added, fostering a more sustainable future for all.
Further achievements and initiatives
We have successfully aligned with these SDGs and remain dedicated to our pursuit.
In addition to our commitments, we have published comprehensive guidance on reducing emissions in remote work settings - including energy-saving habits, managing e-waste, and sustainable furniture recommendations - to increase awareness among our team.
Importantly, growing driver engagement with greener, grid-friendly charging initiatives remains a continuous endeavor. This includes enrolling more drivers in managed charging programs and encouraging them to move up the managed charging ladder where we can.
Our efforts to increase energy delivered to drivers through managed charging programs have shown promising results, indicating the potential for significant carbon savings in the future. We’ve also seen that active managed charging is 3 times more effective at generating carbon savings than passive managed charging through static timers in vehicles and chargers.

These goals propel us forward in our mission to mitigate carbon emissions, fortify the energy grid, and deliver cheaper, greener, and simpler EV charging for everyone.
Final note
In our latest Carbon Impact Report, we are thrilled to announce ev.energy is carbon-negative for the third year running.
Through our rapidly advancing EV VPP and managed charging technology, as well as strategic initiatives aligned with the United Nations' Sustainable Development Goals, we've doubled our carbon savings, showcasing our commitment to reducing emissions and supporting renewable energy integration.
With continued efforts to expand our user base and promote environmentally friendly practices, we are poised to make an even greater impact in the years ahead, driving towards a greener, more sustainable future for all.
We’d like to thank Sandy Neill, Addie Melvin, David Cross, and James Pratley for the production of this report.
Ready to drive change? Discover our managed EV charging solutions or download the ev.energy app today.
%20(1).png)


.avif)


